
Researching weight scales
Chasing 0.4g of missing food in my cat feeder.
Weight scales - engineer’s cat feeder’s worst nightmare
While working on my over-engineered cat feeder with two weight scales (one for the food bowl, one for the cat weight), I noticed strange phenomenon: the weight of the empty food bowl would change over time. I couldn’t figure out the reason for this - it could be anything from my cat poking the food bowl with the chin too much (and flexing the sensor beyond its operational limits), or the ambient temperature/moisture impacting the cell sensor/ADC converter… or just some noise in the system… or something else. Anyways, the weight of the bowl before/after feeding the cat fluctuated from 0.3g to 0.8g over the full-scale range of 200g, over a few days period. My cat eats from 4g to 8g portions, so even 0.5g swing is a lot (it accumulates to 10%..20% of total cat food consumption). This is unacceptable. There needs to be a better way!
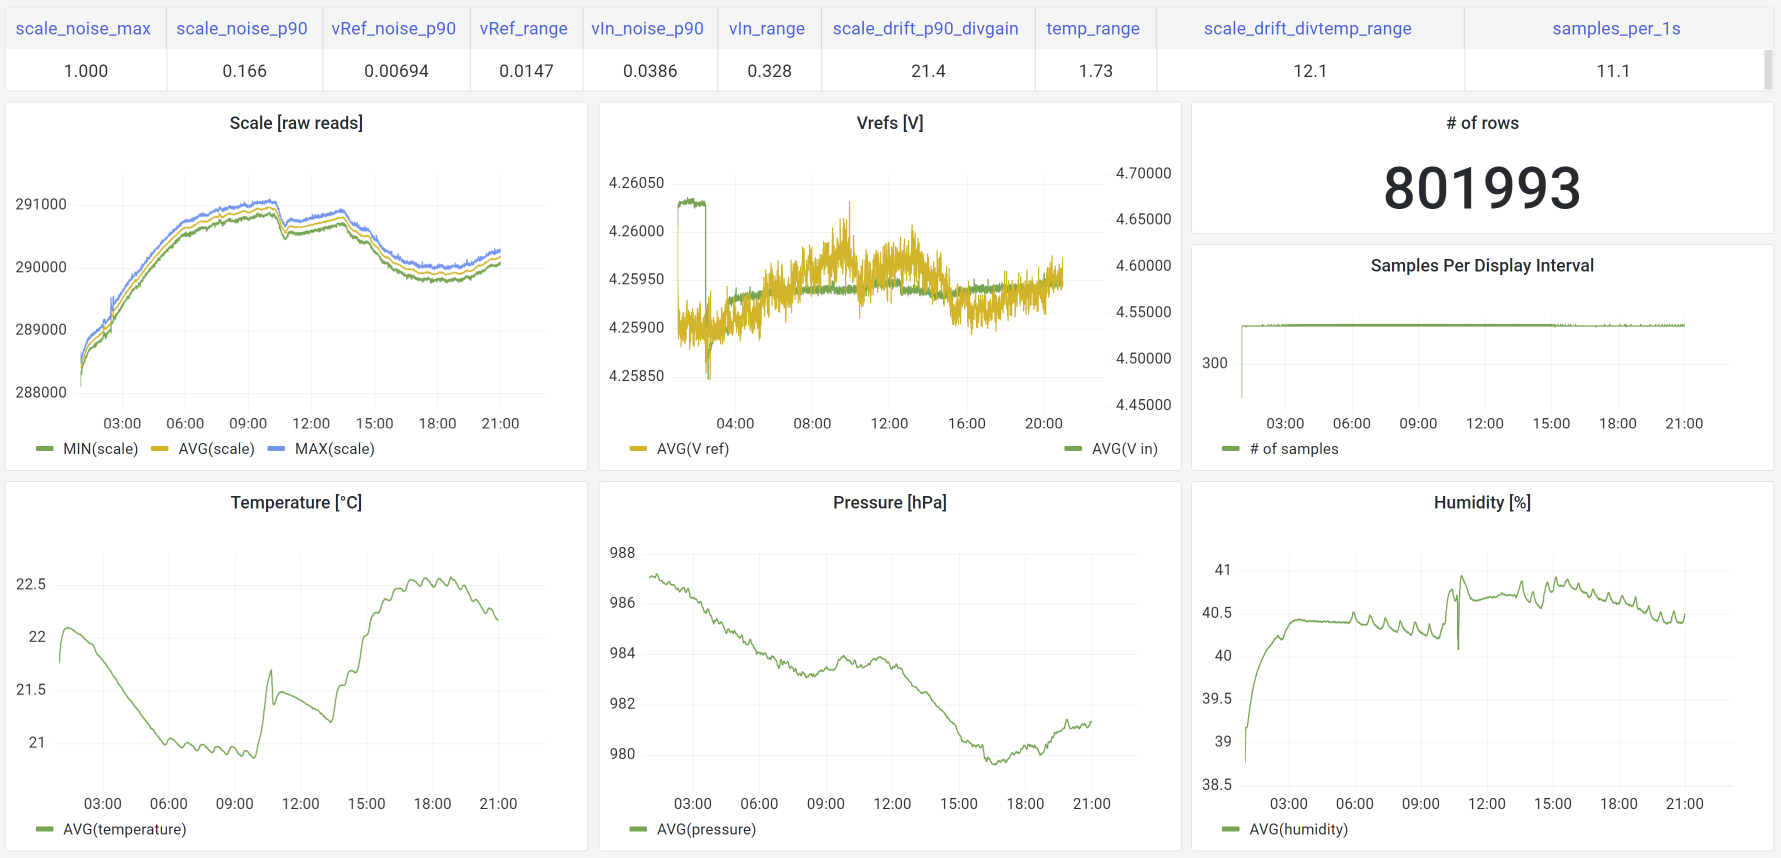 Sample weight scale test run visualized - 20h, 800k measures
Researching weight scales
Goals of this research project are:
- identify temperature/moisture/pressure impact on weight scales,
- investiate long-term load cell sensor stability/drift,
- identify reference voltage impact on weight scales,
- identify ADC chip impact on weight scales,
- evaluate if Machine Learning can be used to introduce temperature compensation for weight scales.
In order to complete the goals above, I plan to record and analyze millions of captured datapoints from different hardware configurations. I’m not only interested in short term precision, but on long term stability as well.
Setup
I’ll start with quite rudimentary testing approach and improve where needed.
Hardware - Data Collector
My collector will include a few components which will be relevant only for the research phase - after the research is done, new and simplified hardware can be used to utilize research results. Initially the data collector will consist of:
- microcontroller - ESP8266 - had lying it around & needed internet based timestamp for post processing
- ADS1115 - 4channel, 16bit ADC to read reference voltages
- BME280 - I2C/SPI temperature, humidity, pressure sensor
- SD card - to store captured data
- [optionally] small fan to distribute heat evenly in the environment
- [optionally] designated reference voltage for cell sensor ADC
- [variation of] different power supplies
- [variation of] different sensor ADCs (HX711, NAU7802)
- shoe box with a lid, some wood, and a bunch of wires
Firmware - Data Collector
I’ve written some ugly C code to capture different measures (like: timestamp, input voltage, iteration, scale reading, …), store up to a few kB of them in ESP8266 memory, and then flush periodically to SD card. To make the resulting data easy to post-process, I’m including epoch time of every measure iteration. This is only an approximate time, which I’m getting by retrieving the current epoch time from the internet upon the start of the experiment. Then I turn the Wi-Fi off to reduce potential noise.
Software - visualizing and processing millions of captured measures
I plan to experiment and analyze stability of measures across multiple days. At 10 samples per second (SPS) from the cheapest ADC - HX711, this will equal to 864k measures per day. Each of the measure will be accompanied by all data above, effectively meaning I’ll have around ~10M measures per day from a single experiment. I doubt Excel will help here :)
Instead, I’ll use Amazon S3 to store the files, and I’ll query them with serverless Athena service. S3+Athena combination is powerful, yet a cheap way for ad-hoc analysis of the data. Furthermore, I’ll convert the CSV files to Parquet files (columnar format), which should decrease the file size A LOT (due to similar/same values for most of measures). Finally, I’ll visualize the data with Grafana, which will allow me to quickly build dynamic graphs on my data.
Next steps
Start collecting the data. Analyze & visualize (as above… and more). Learn & repeat! Stay tuned!
Please note: the views I express are mine alone and they do not necessarily reflect the views of Amazon.com.